Detecting mislabels in healthcare data, unsupervised.
An unsupervised error-detection method, applied to ICU sepsis records. Published in Bioengineering (MDPI), Vol. 11, No. 8, 2024.
why this matters
Medical datasets are imbalanced and contain errors due to subjective test results and clinical variability. Poor data quality affects the accuracy and reliability of every downstream classifier. Surfacing abnormal samples lets clinicians make better decisions, but most error-detection methods require ground-truth labels we don’t have.
what we did
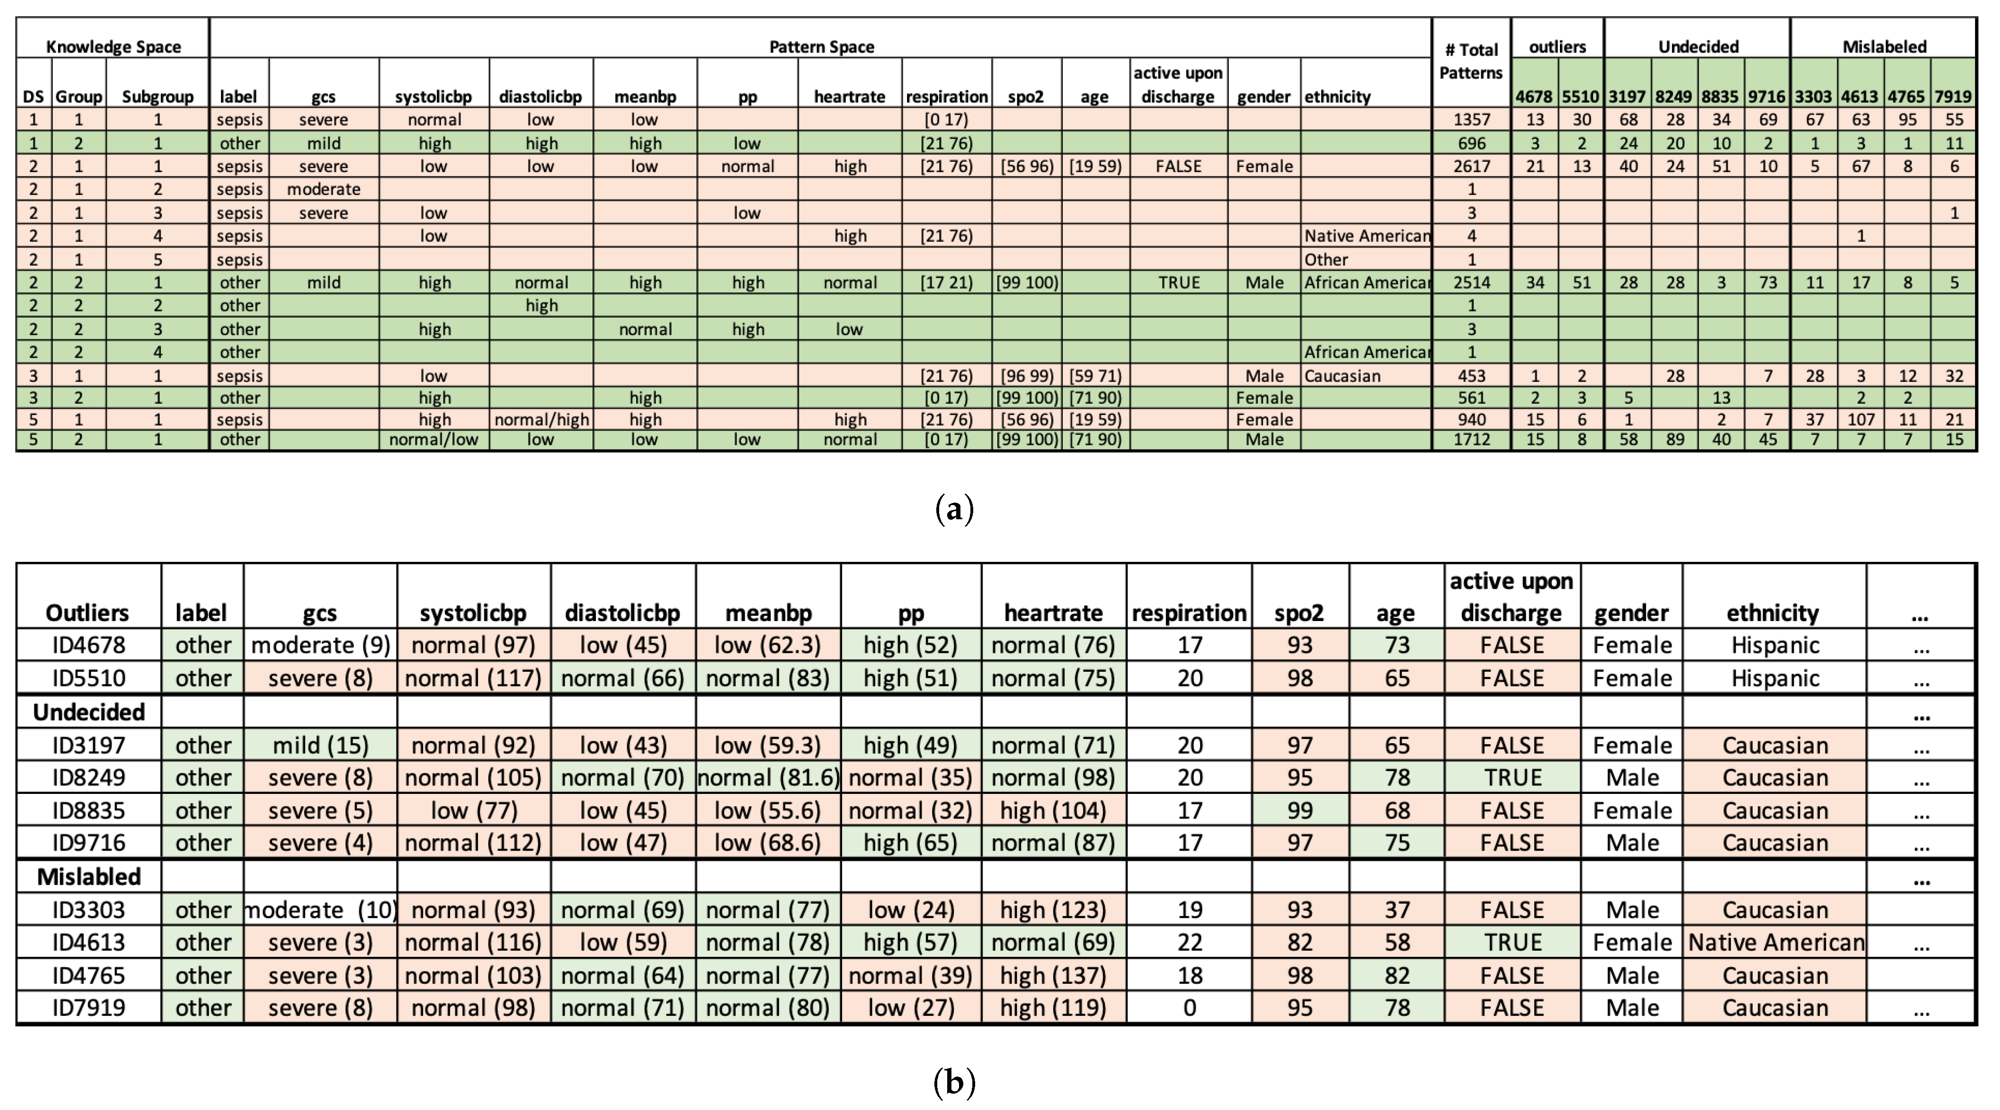
- ·Discover statistically significant association patterns. We applied the Pattern Discovery and Disentanglement (PDD) model, from earlier work by the lab, to the eICU Collaborative Research Database for sepsis risk assessment.
- ·Cluster samples and flag anomalies. PDD generates an interpretable knowledge base, clusters samples in an unsupervised manner, and identifies abnormal samples whose pattern signature is inconsistent with their assigned label.
- ·Re-train downstream classifiers. We removed the flagged samples and re-trained multiple supervised classifiers, then compared their accuracy against the same models trained on the noisy original.
what we found
PDD beat K-Means at unsupervised clustering and made every downstream classifier more accurate.
+38%
vs K-Means · full dataset
+47%
vs K-Means · reduced dataset
+4%
avg supervised accuracy gain
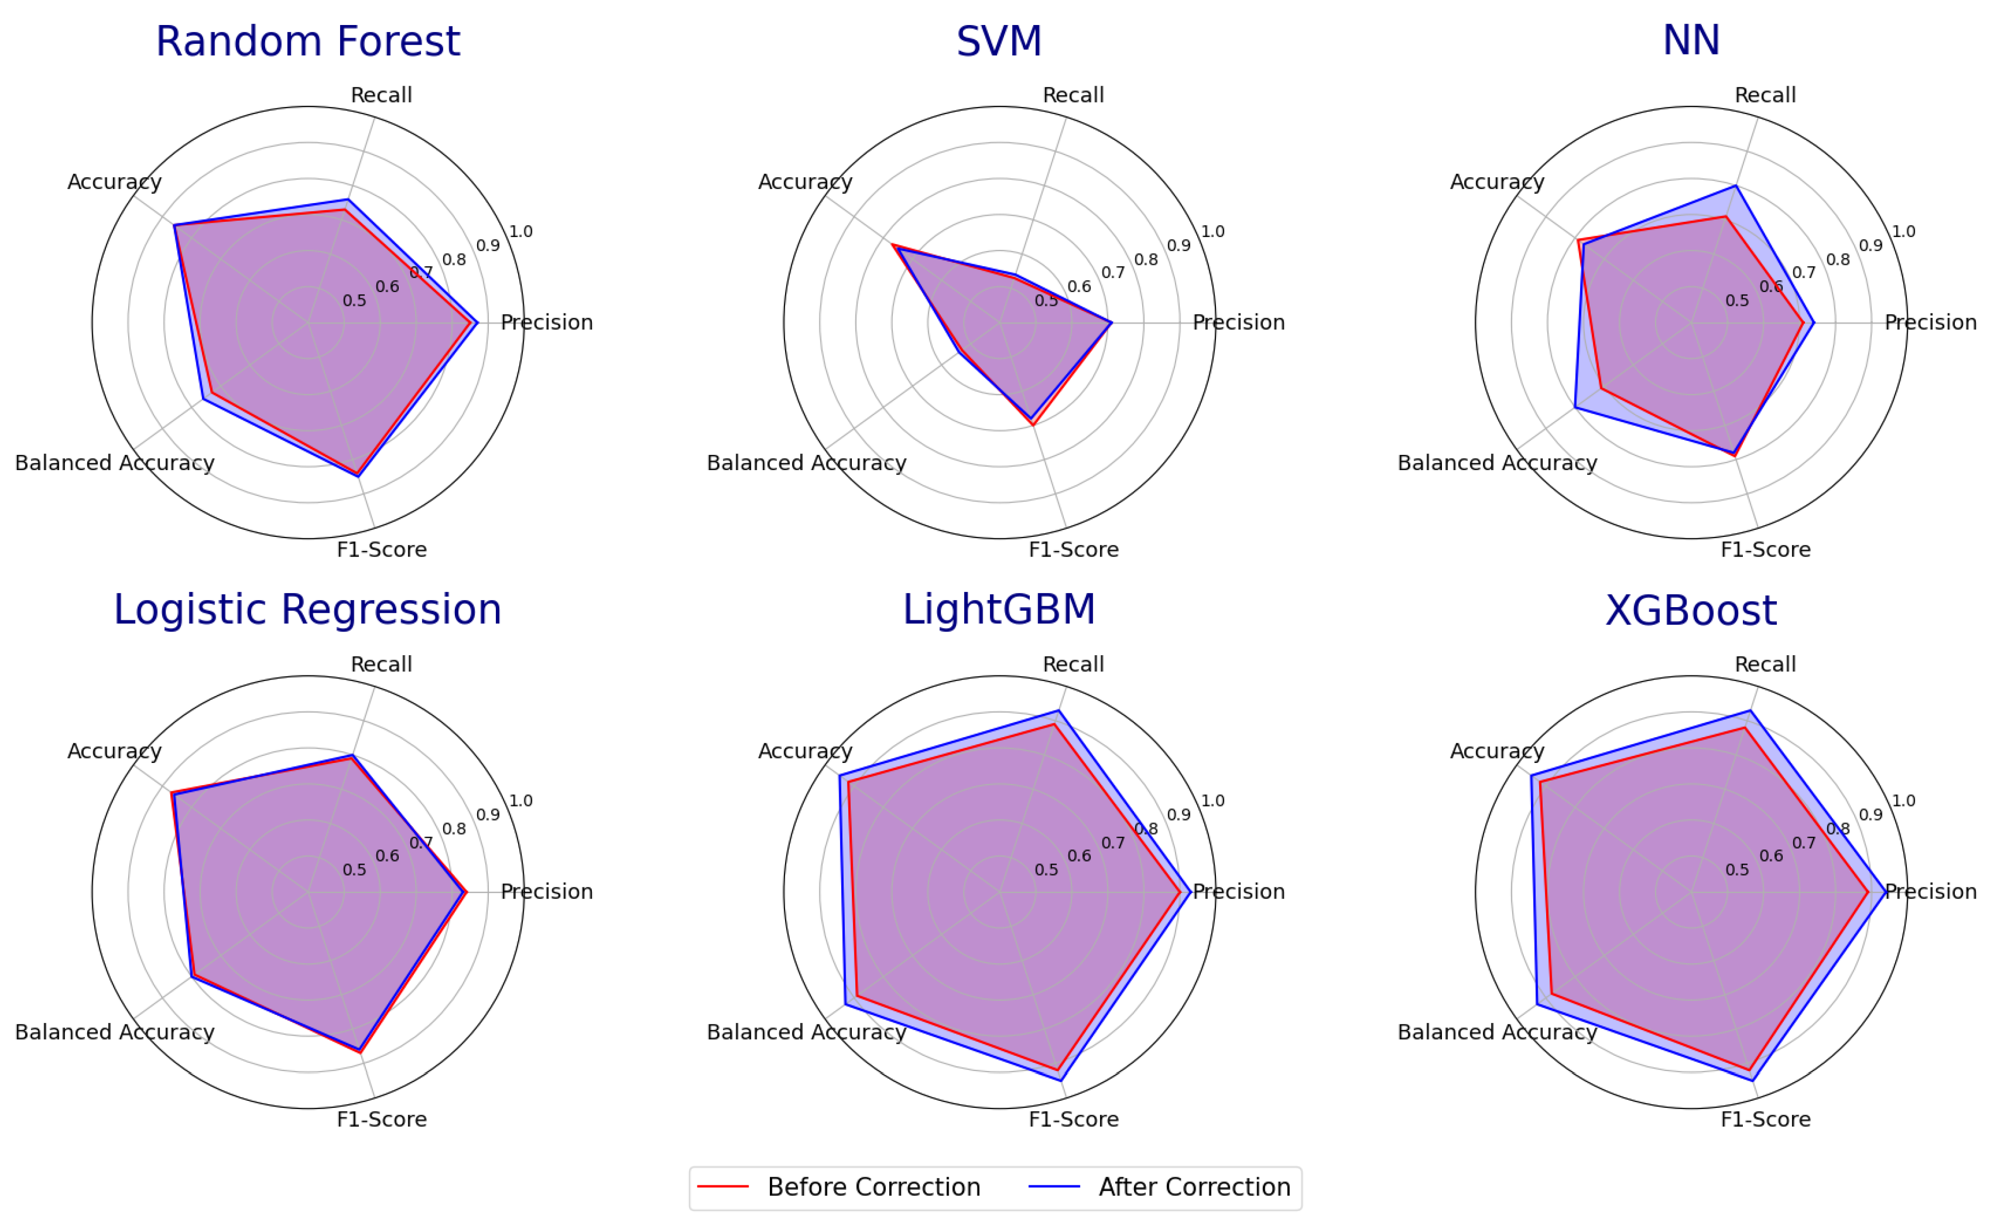
On unsupervised clustering, PDD outperformed K-Means by 38% on the full dataset and 47% on a reduced dataset. When we removed the samples PDD flagged as abnormal and re-trained multiple supervised classifiers, their accuracy improved by an average of 4%. The flagged samples also serve as a review queue: a clinician can decide case-by-case whether to relabel or drop, instead of trusting noisy chart labels uniformly.