Virtual gene knockouts for target discovery in colorectal cancer.
A computational-first target-prioritization loop at Harvard Medical School. Gene regulatory networks inferred from a GI single-cell atlas; in-silico knockouts prioritize regulators that restore differentiation in CRC cells, then hand a ranked shortlist to the wet lab for validation.
why this matters
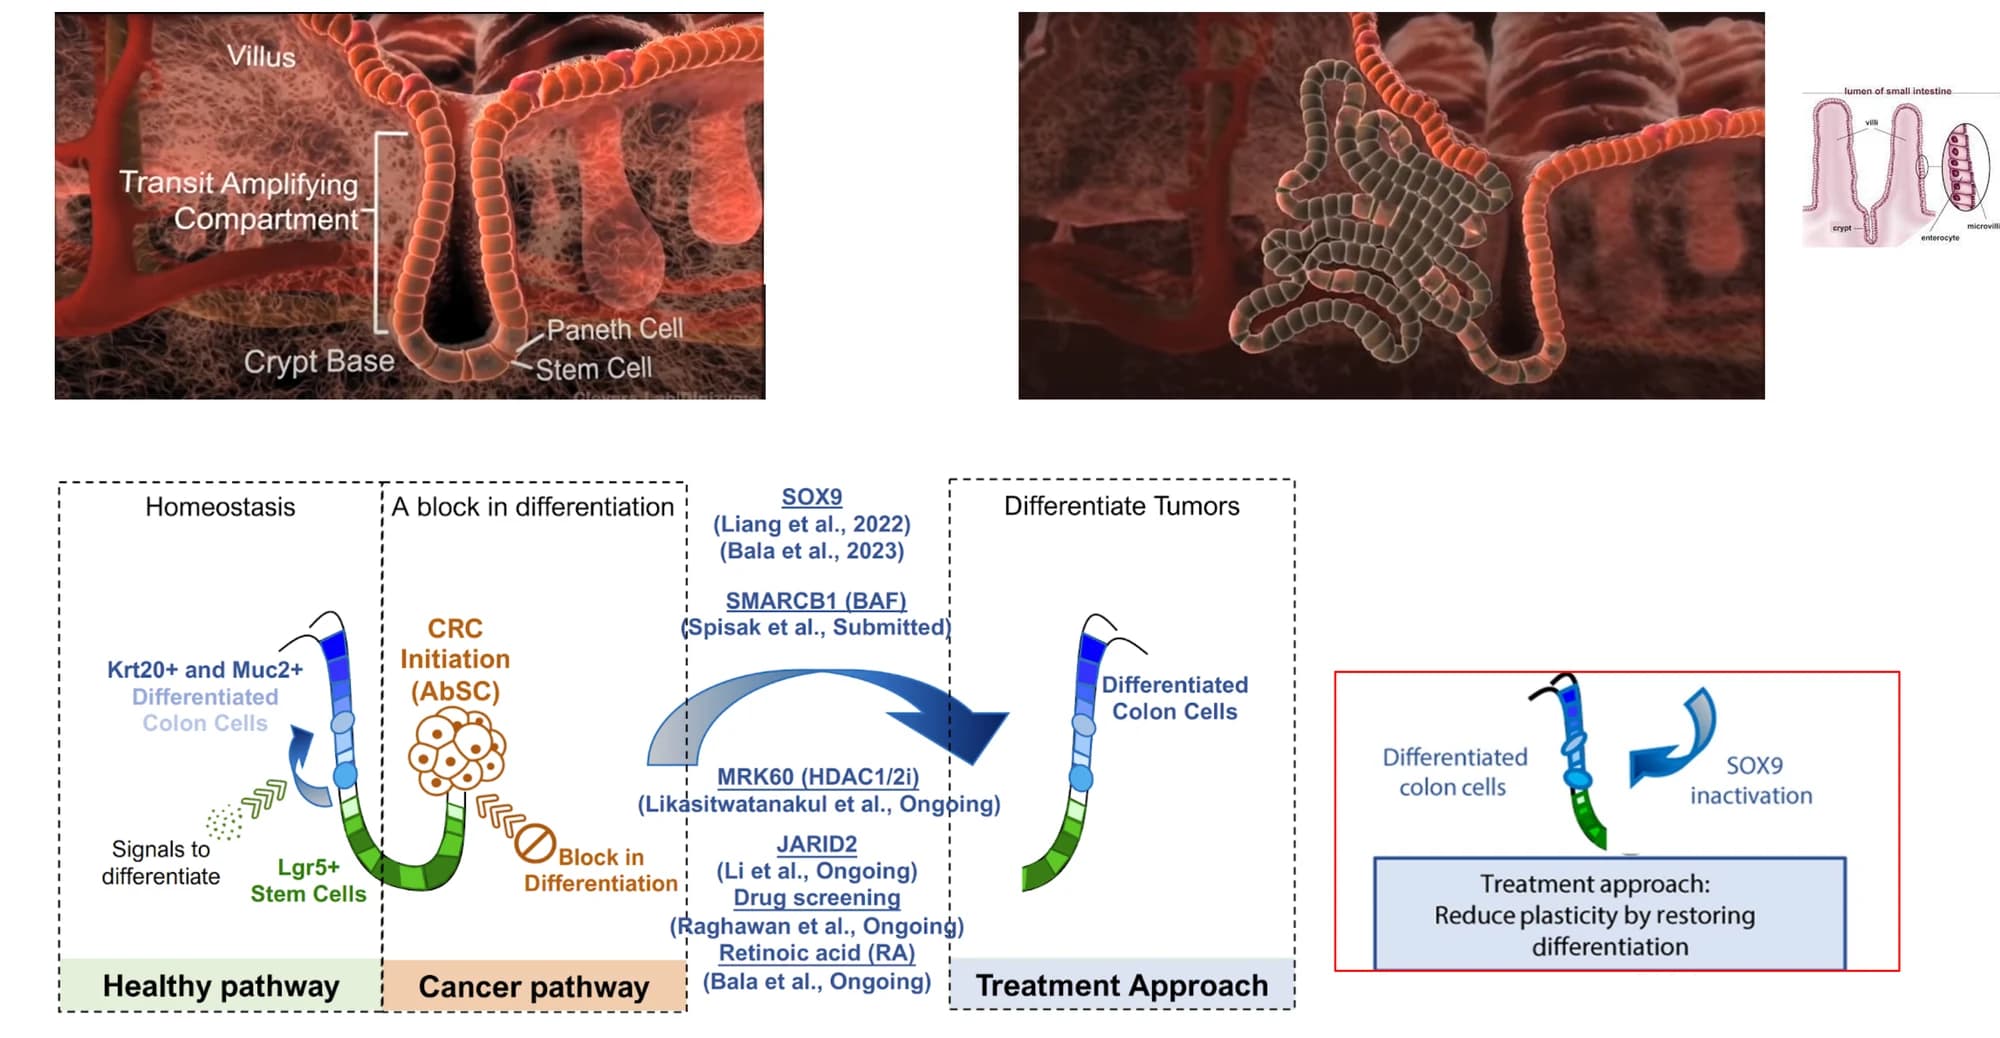
Colorectal cancer initiates as a block in differentiation: Lgr5+ intestinal stem cells fail to progress into Krt20+/Muc2+ enterocytes and accumulate as an aberrant stem-cell pool. A promising therapeutic strategy is to reduce that plasticity by restoring the differentiation trajectory, but the space of candidate regulators (transcription factors, epigenetic modifiers, chromatin remodellers) is enormous, and every wet-lab knockout is expensive.
We ran the front half of the target-discovery loop in silico: infer the regulatory network directly from single-cell data, simulate each candidate knockout, and score each by how far it shifts cells along the stem → transit-amplifying → enterocyte trajectory. The output is a ranked list the wet lab can prioritize instead of screening blind.
what we did
- ·Built a GI single-cell atlas. Integrated multiple scRNA-seq datasets spanning normal and cancerous GI tissue; filtered on library QC and SCANVI cell-type confidence; subset to the stem / transit-amplifying / enterocyte axis and the 3,000 most-variable genes.
- ·Inferred cell-state-specific GRNs. Used Cell Oracle with a SCENIC/ATAC-derived base network to fit a separate gene regulatory graph per Leiden cluster, so a TF’s downstream targets are context-specific, not shared across all cells.
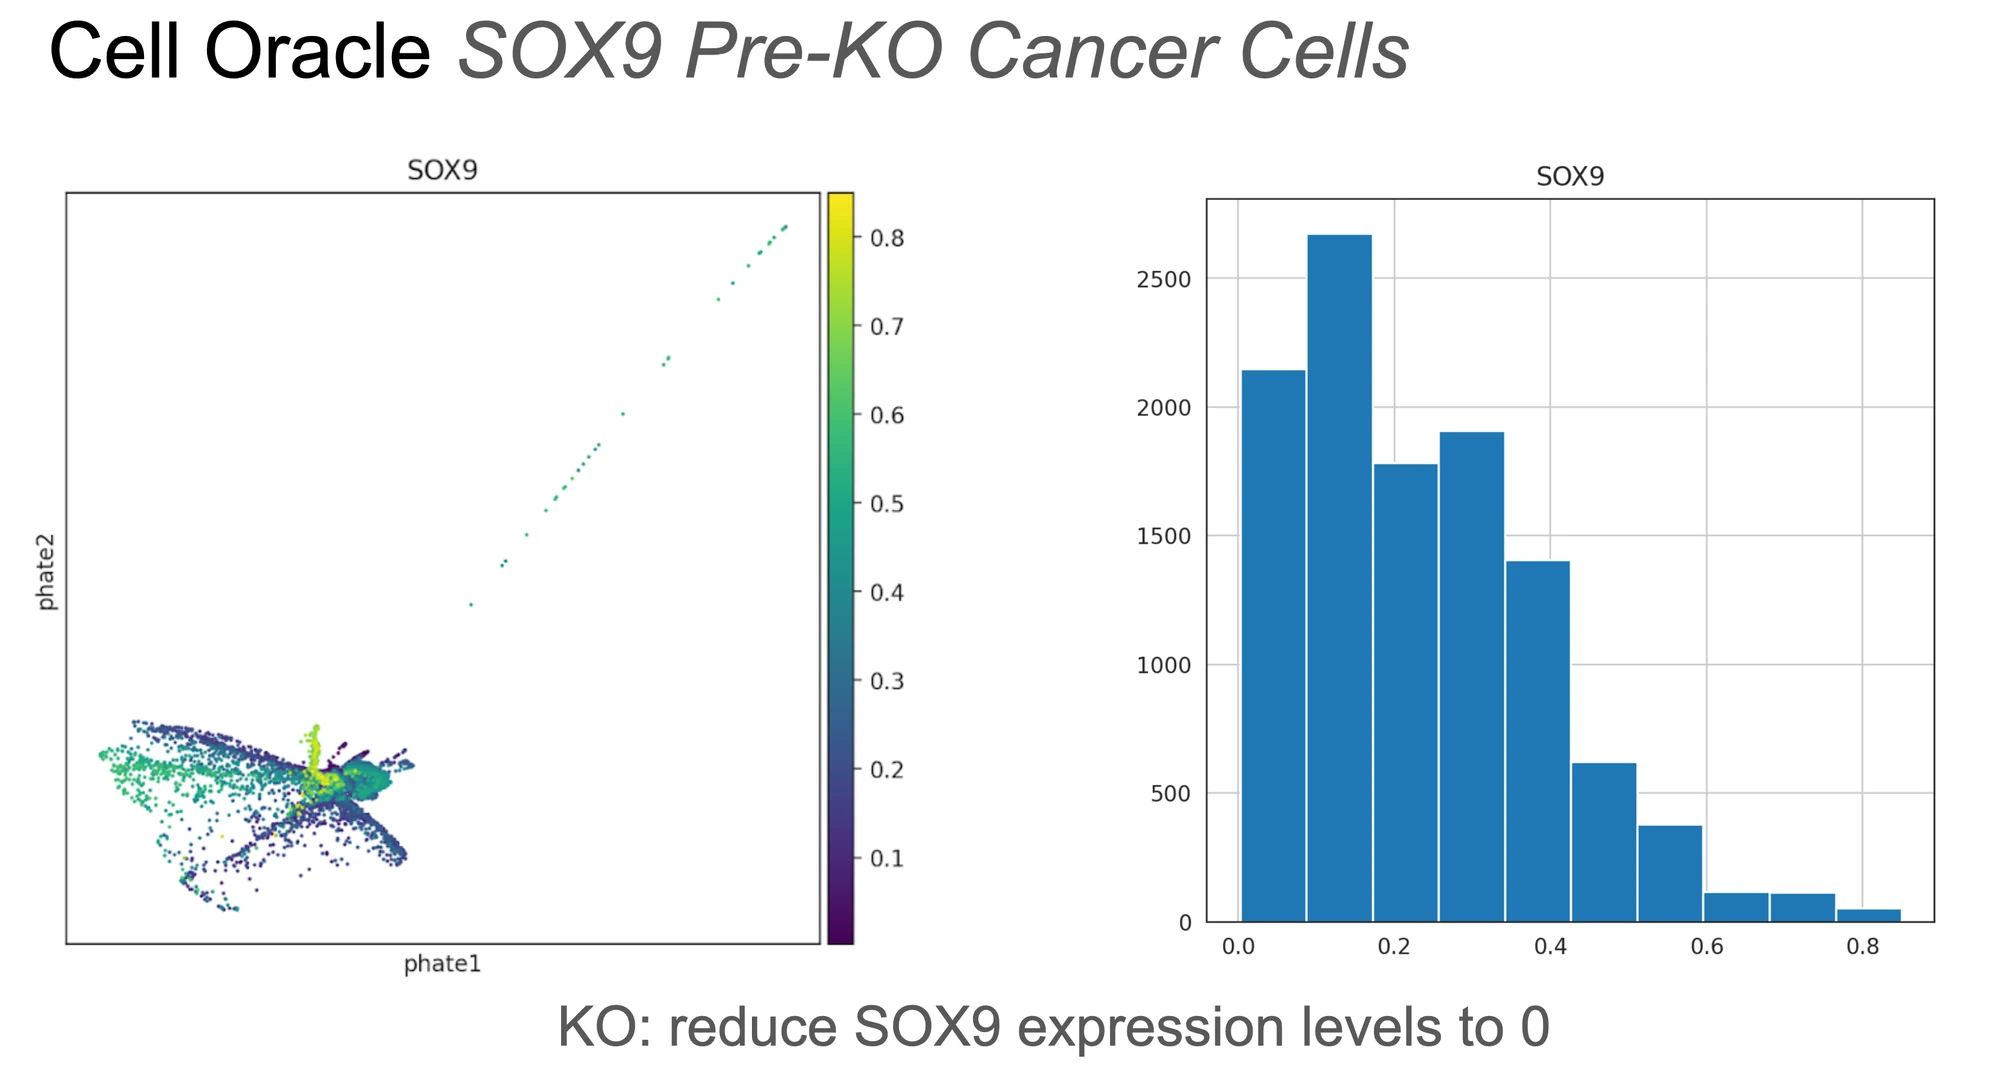
- ·Simulated knockouts as signal propagation. For each candidate TF, set its expression to zero and propagate the shift through the fitted GRN; the resulting transition-probability field on the embedding is the predicted cell-state effect.
- ·Handed ranked candidates to the wet lab. The pipeline outputs a shortlist ordered by predicted differentiation-restoring effect. This mirrors a compute-first / experiment-validated loop: computation narrows the hypothesis space, the bench adjudicates.
the method
A three-stage in-silico screen: infer → simulate → rank.
- 01
Fit cell-state-specific gene regulatory networks from single-cell data.
+detailshide
Cell Oracle takes a base GRN (SCENIC-derived from scRNA-seq, or ATAC-seq-derived from co-accessible peaks) and refines it per Leiden cluster using PCA + KNN imputation. The result is a directed weighted graph per cell state: TF → target-gene edges whose weights reflect regulatory strength in that specific context. This context-specificity is the point: SOX9's downstream targets in a stem-like cluster are not the same as in a transit-amplifying cluster.
- 02
Simulate a knockout as signal propagation on the GRN.
+detailshide
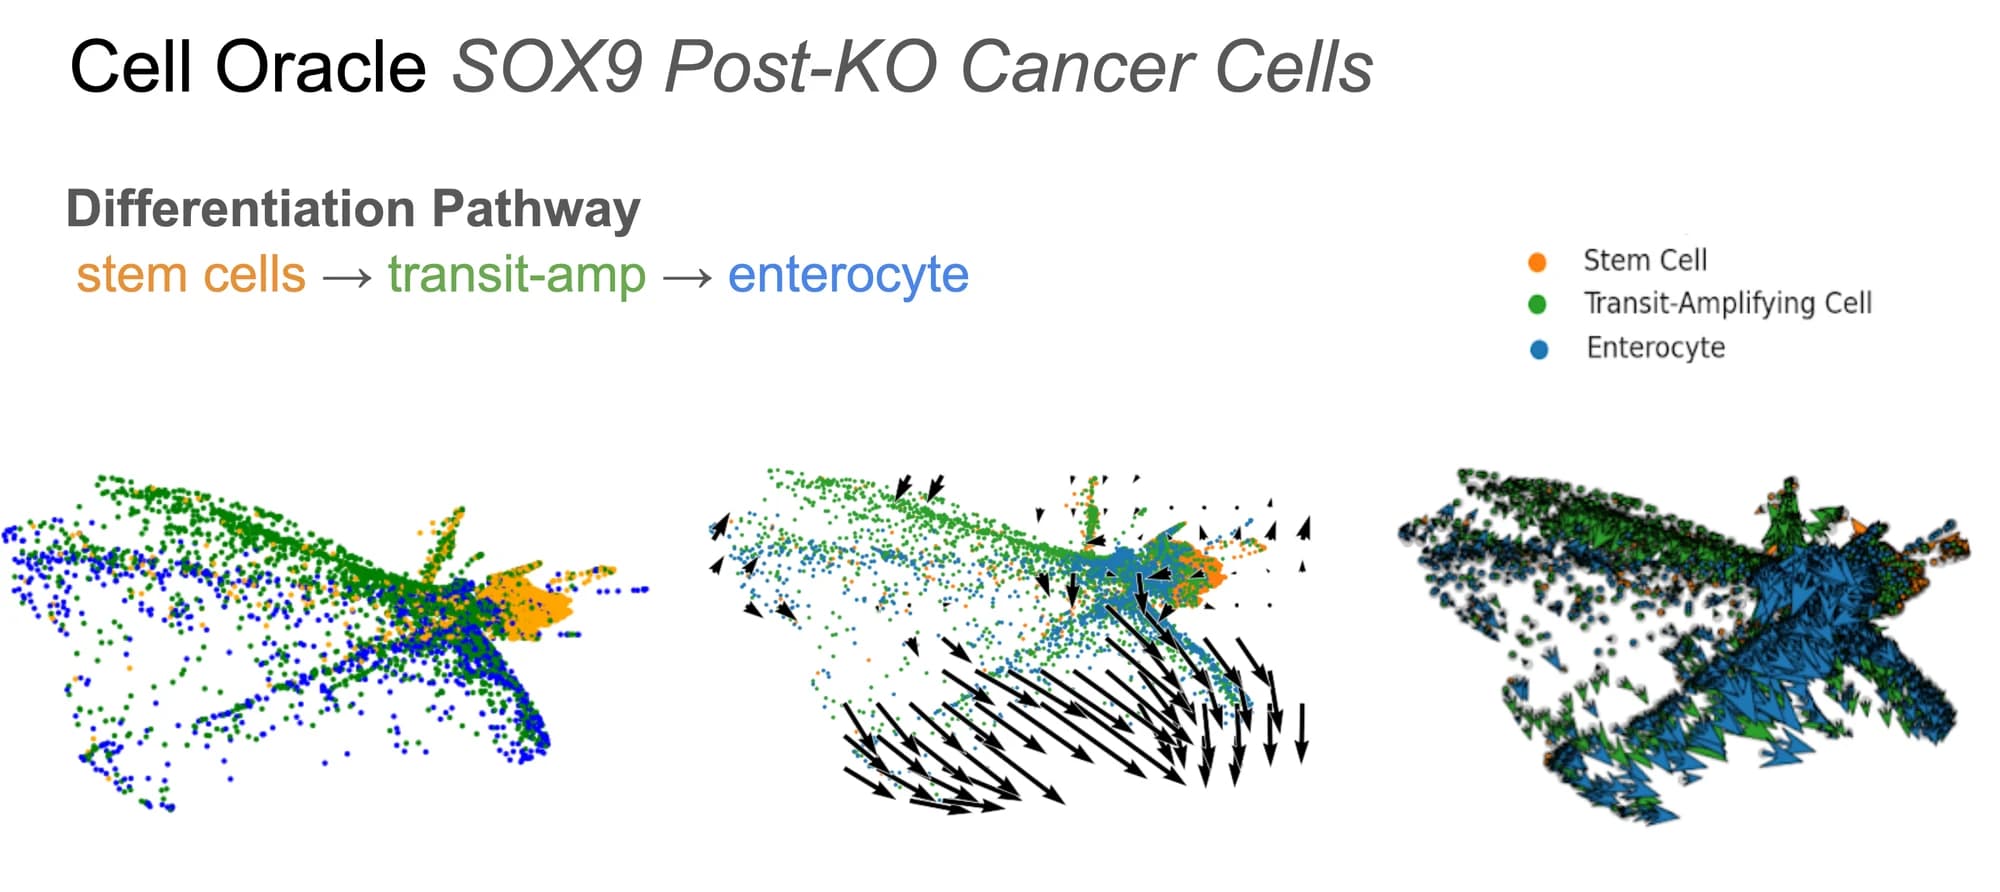
For a candidate TF, pin its expression to zero and propagate the perturbation through the cluster-specific GRN. Cell Oracle then computes a transition probability for every cell: the likelihood it moves toward each of its k-nearest neighbours in the embedding under the perturbed regime. Aggregate transitions become a vector field on the PHATE embedding, one arrow at every cell indicating where the knockout is predicted to push it.
- 03
Score candidates by predicted movement along the differentiation trajectory.
+detailshide
Project the per-cell transition vectors onto the stem → transit-amplifying → enterocyte axis. Candidates that push cells forward along that axis (i.e. restore differentiation) rank high; candidates with null, reversed, or diffuse effects rank low. The output is a shortlist the wet lab can screen instead of guessing.
method validation
Reproducing a canonical lineage switch on a gold-standard dataset.
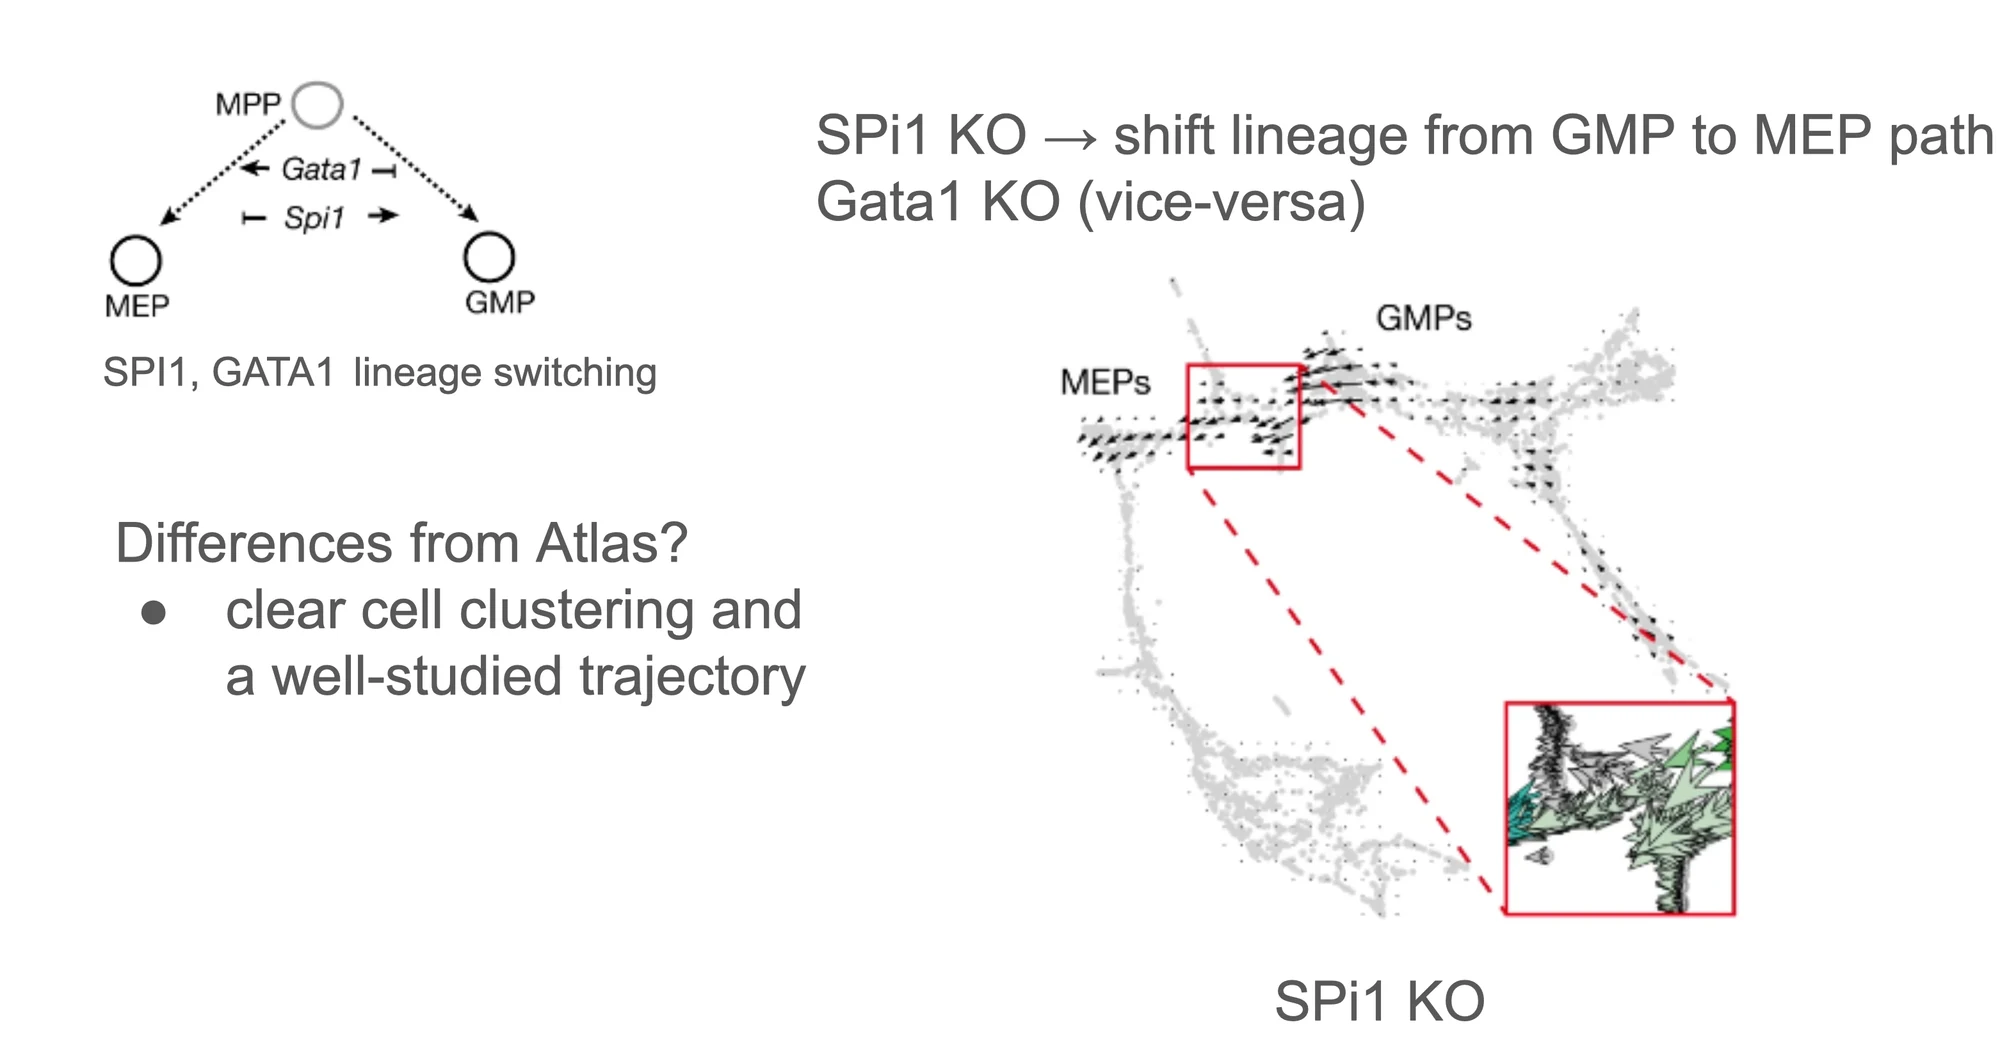
Before applying the pipeline to a novel cancer atlas, we validated it on Paul et al. 2015, a well-characterized hematopoietic differentiation dataset with a known regulatory switch: Spi1 and Gata1 mutually antagonize each other and steer multipotent progenitors down GMP (myeloid) vs. MEP (erythroid) lineages respectively. If the tool is trustworthy, Spi1 KO should push MPP cells toward the MEP branch, and Gata1 KO the opposite. It did, cleanly, with the vector field bending along the known trajectory.
proof of concept · sox9 in crc
Virtual SOX9 knockout shifts cancer cells along the differentiation axis.
SOX9 is a known stemness regulator in CRC and an established differentiation-restoring target (Liang 2022, Bala 2023). We used it as a positive-control candidate: if the pipeline works, an in-silico SOX9 KO in cancer cells should push them from the stem-like compartment toward the enterocyte compartment. It did.
~12k
cells after QC
3,000
most-variable genes
3
cell states on the axis
1
target validated in silico
limitations
Where the pipeline is honest about what it can and can’t claim.
- ·Sampling depth vs. atlas size. Cell Oracle’s per-cluster GRN fit scales poorly to the full atlas, so we sample a subset. Weighted sampling is the obvious next step to preserve rare cell types that uniform sampling drops.
- ·GRN generation caps the perturbable TF set. You can only knock out TFs that appear in the fitted network with enough downstream targets to propagate a signal. Sparse or poorly-covered TFs are silently excluded.
- ·Interpretability needs a trajectory. Vector-field outputs are only meaningful if the embedding resolves distinct clusters along a biologically interpretable axis. On noisier or continuous manifolds, the direction of “progress” is ambiguous.
- ·No exact expression levels. Cell Oracle produces directional predictions (where a cell moves), not absolute post-KO expression values. The output is a ranking, not a quantitative dose-response.
what’s next
Same pipeline, unbiased screen. Toward a target-prioritization primitive.
unbiased screen
Systematic in-silico KO across every perturbable TF (and the epigenetic-factor lists curated by the lab), scored by projection onto the differentiation axis. Cross with known druggability annotations to output a ranked, druggable shortlist.
bidirectional test
Perturb epigenetic factors upregulated in normal stem cells within the cancer subset: do cancer stem cells become more normal-like? And vice versa. Symmetry (or its absence) is a signal about the underlying mechanism.
validation & scoring
Beyond Paul 2015: run the pipeline on additional gold-standard datasets with known outcomes, subsample for stability, and add network-scoring metrics so a candidate’s rank comes with a confidence interval, not just a point estimate.
composability
The pipeline outputs a ranked TF list, a target-discovery primitive that composes downstream with structure-based screens, ADMET filters, or protein-ligand modelling once the target has been picked.
my role
I built the computational side of the loop end-to-end: atlas preprocessing at scale (integration, QC, SCANVI confidence filtering, subsetting to the differentiation axis), GRN inference via Cell Oracle with a SCENIC/ATAC base network, the knockout-simulation and trajectory-scoring code, and the Paul 2015 gold-standard validation harness. Output: ranked candidate lists delivered to the wet-lab team for downstream CRISPR follow-up.